The major root causes behind SLA degradation
A breakdown of the most common root causes behind SLA degradation, from outages and DNS issues to 5XX errors and DB failures, with the monitoring actions that catch them next time.


In the previous article, we described SLO and SLA and how to measure them on a WebServer like Nginx or Apache, and in this article, we will discuss the major root causes that decrease the SLA and how to deal with them.
SLA Time-based :
Time-based SLA is either Online or Offline and a Server can be offline for several reasons, in the following table we will gather all the most common root causes and the actions that should be taken, also the monitoring acti0n to perform to get notified when the issue happens again.
| Root Cause | Action to take | Monitoring action |
|---|---|---|
| Outage | Could be Datacenter, Check the Cloud Provider status page | Review the SLA with your Datacenter or with your Cloud Provider |
| DNS issue | Check DNS records for any miss-configuration | Setup notifications for any DNS Changes, Review SLA with your DNS provider, Monitoring with HTTP and ICMP |
| Security | Double-check for any firewalls upgrades, check firewall rules | Uptime monitoring, using ICMP pings and HTTP requests to the endpoint |
| Dependencies outage | Check Database Connection, Dependent APIs | HTTP requests to concerned endpoints |
Note: Uptime SLA is important to track how long the application is running per day, but this doesn't count if this application is buggy or doesn't respond correctly, for we have to calculate the SLA aggregate to track the requests.
SLA Aggregate-based:
Aggregate-based SLA is generally used for APIs, and it measures the successful requests over the failed ones. In the following table, we will list out all the common issues that could drag down the SLA, we will also provide what actions should be taken immediately to confirm the root cause and how to monitor it next time and deal with it directly :
| Root Cause | Action to take | Monitoring Actions |
|---|---|---|
| 5XX | Investigate the bug/downtime part of the app that causes the error | Use Error Tracking system like Sentry or glitchtip ..etc |
| DB Failures | Check Logs, Metrics of the DB server | Log time-consuming queries, apply monitoring on the server metrics, optimize queries for better response time |
| Ressources shortage | Check the metrics (CPU, Load, RAM, Disk, IO ..etc) | Set alarms, Metris logs such as TICK Stack |
| Single Point of Failure | Check the responses from the main apps that the app depends on | Harden the availability monitoring, try to avoid as possible SPF |
Error Tracking is very important
Without a tool for Error Tracking, you can't find bugs and errors that crash the productions, which sometimes can be impossible.
Getting notified once an error occurs for a user during his experience is very useful and will give you also the exact scenario to reproduce the same issue and solve it quickly.
Learning from the error log history will optimize code healthily and stabilize the SLA, then after waiting for a few days the balance of successful requests will go higher which increases automatically the SLA.
Cache
The cache is great, there's nothing best than Cloudflare which serves a cached copy from its Cache Edges, even if the server is down, which will keep the SLA stable until the server issue is solved.
CleverCloud
I am a big fan of CleverCloud since it uses Blue/Green Deployment which keeps your CI/CD easier and prevents any downtimes during releases.
BlueGreen
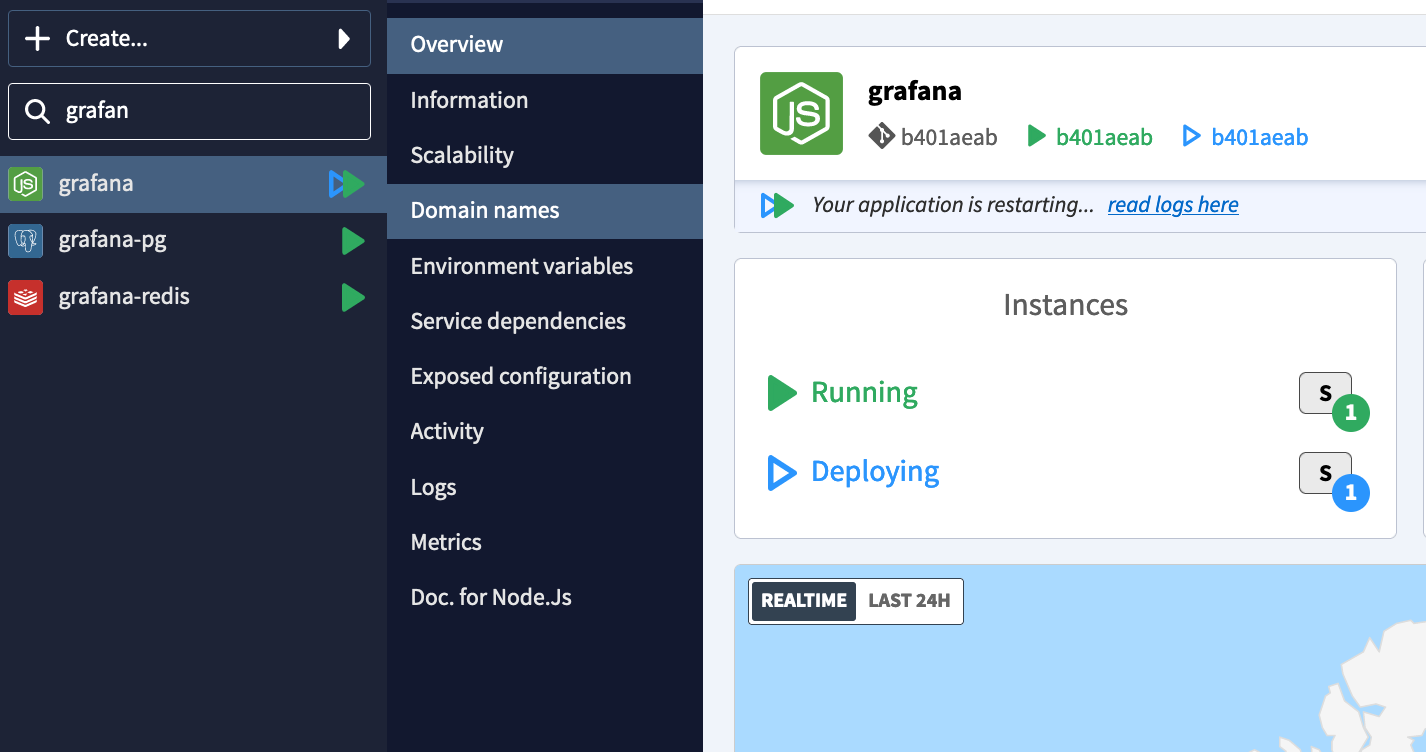
With CleverCloud you can get also auto-scaling architecture very easily, if one of your servers gets too many requests, Clevercloud will trigger the deployment of new servers for your application to support the load, instead of the increase of your response time which slows down the app or take it down.
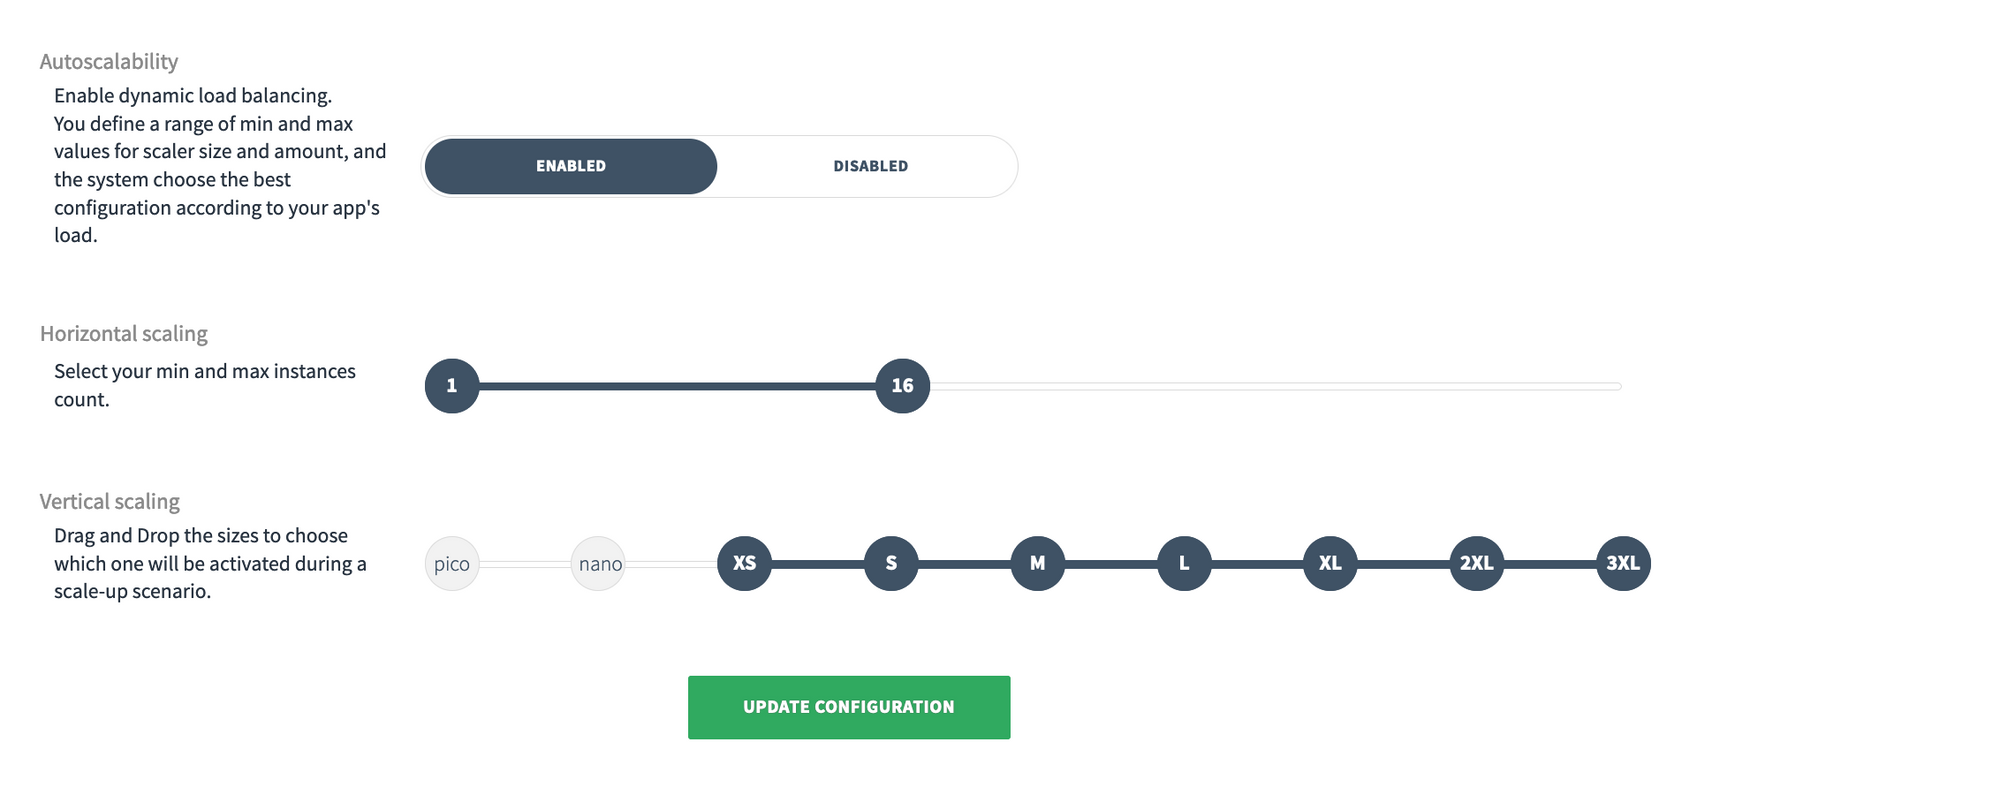
In this screenshot, we have an example of an app deployed on CleverCloud with auto-scaling enabled, it can go up to 16 instances Horizontally and each instance will increase from XS to 3XL.
CleverCloud Can also give you an overview of your daily SLA for a specific app or for the total apps created for the last 24 hours.
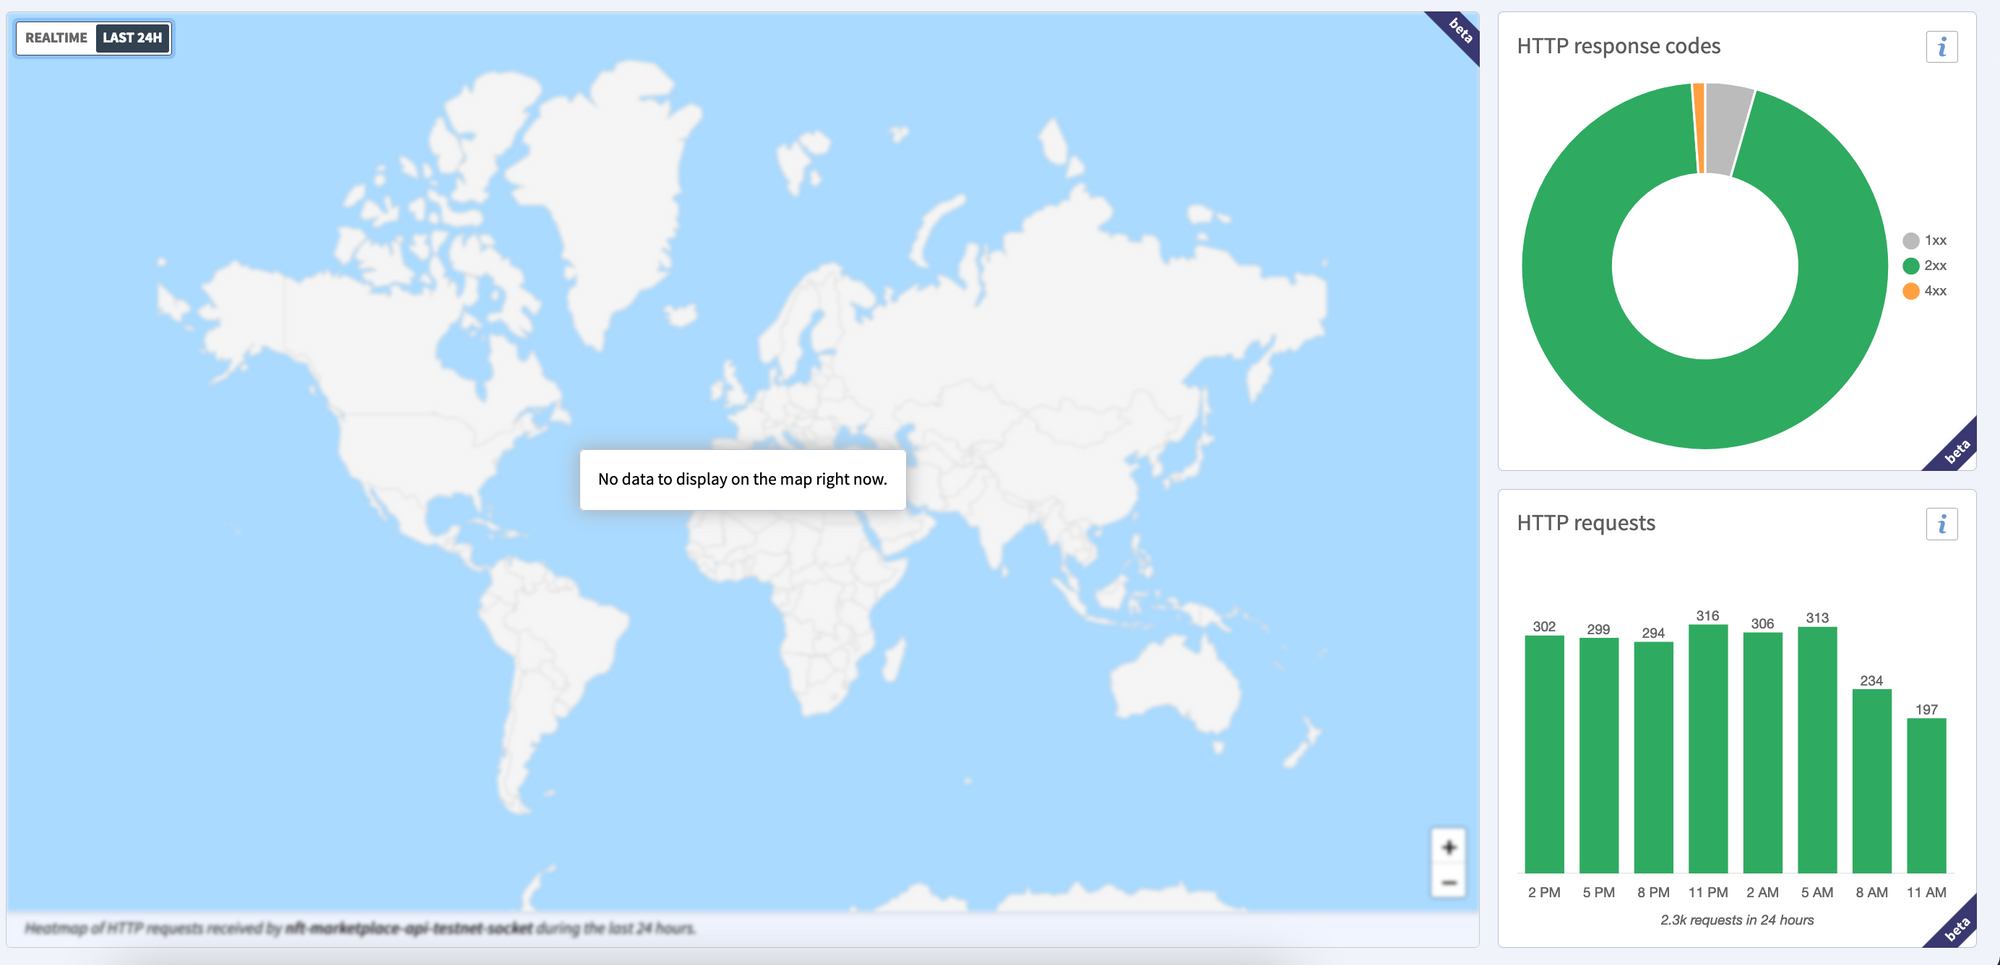
Source: https://www.clever-cloud.com
What to do if the SLA keeps going down?
When you think an SLA breach has occurred, here’s what to do:
The first action is to as soon as you noticed the issue is communicating the issue internally with the dedicated team, and include everyone, through the available communication channels, Email, Slack, Telegram, ..etc.
A status page is a great tool to communicate with the public(clients, users, audience..etc), We recommend using tools like CachetHQ, Gatus, Statping ..etc
Since no cloud provider will commit to the perfect achievement of targets, have to be aware that SLA breaches can happen at any time, for that designing your software should consider SLAs since day 0.
One way is to factor in SLAs during the design of the service rather than bolting them on after going live.
By investigating root causes and coming up with workarounds and improvements, any issue that causes repeat SLA breaches can be addressed, whether it involves:
- Greenkeeping and upgrading the stacks
- Team training/coaching
- Improving the Design Pattern of the architecture.
- Revamping old projects that use deprecated technologies/libraries
- Invest in the Sysadmin Team(Hire more Ops/Dev people)
Monitoring and alerting particularly with thresholds to warn/notify before a catastrophic incident occurs.
Automated workflows help with reducing human intervention especially during off times and holidays, and shortening the intervention time.
Planning for SLA breaches
It isn’t possible to avoid every single SLA breach—some are bound to happen. But by preparing for them in the first place, you can limit the damage they might cause.
Conclusion
Understanding and investigating is not an easy task especially when it comes to SLA agreed with clients, and impacts the business.
The best way to increase the SLA for the company is to tackle every problem with proper preventive monitoring, also implementing a log & metric management stack is crucial to get the exact source of errors that causes the SLA degradation.
Where setting up alerts reduces the time to solve the issues and can also prevent them from happening.
You can improve the availability by using several managed services such as Databases, CleverCloud Apps which makes also your CI/CD easier. An availability set is a logical grouping of VMs that allows Azure to understand how your app is designed to provide for redundancy and availability.
SLA Slipping Quarter After Quarter?
We help teams find and fix the real causes behind SLA drops: outages, DNS, dependency failures, 5XX spikes, DB slowness, and resource shortages. We build the monitoring, error tracking, and caching layers that keep regulated workloads inside their targets. Fintech, government, and PCI-DSS teams use us when uptime numbers stop matching reality. Audit our SLA with us.