SLA and SLO fundamentals

SLA and SLO fundamentals

SLA aka Service-Level Agreement is an agreement you make with your clients/users, which is a measured metric that can be time-based or aggregate-based.

SLA time-based

We can calculate the tolerable duration of downtime to reach a given number of nines of availability, using the following formula:  

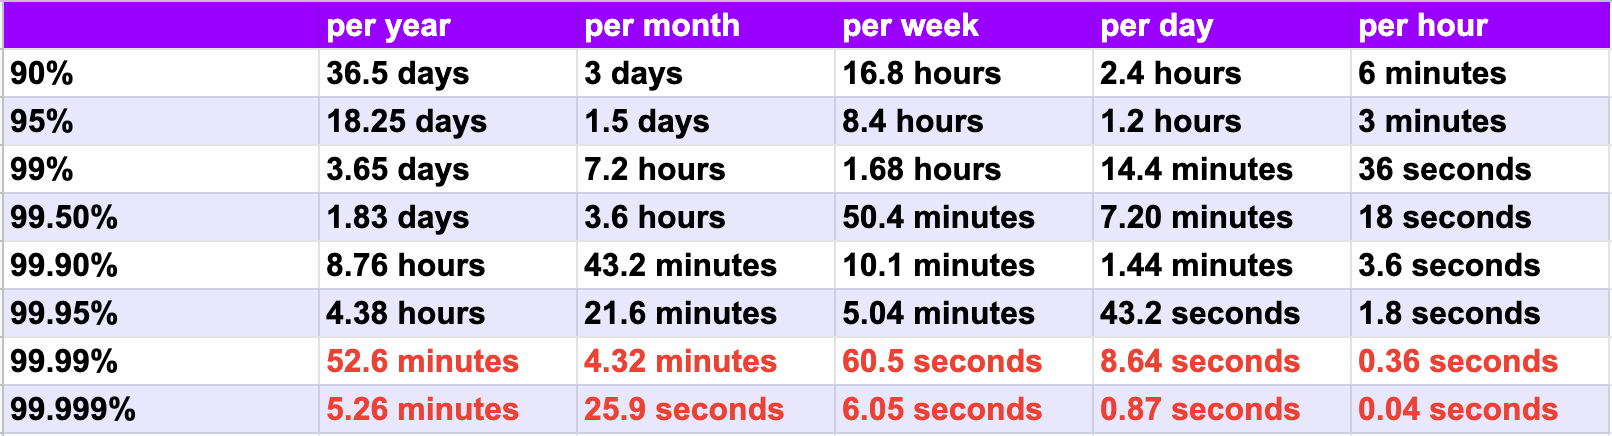
For example, a web application with an availability of 99.95% can be down for up to 4.38 hours max in a year.

The following table explains the maximum duration of tolerated downtime per year/month/week/day/hour.

SLA Aggregate-based

Let's imagine a Backend with an API, that serves 250M requests per day, and an SLA Aggregate-based of 99.99% which cannot exceed more than 25k errors per day.

Note that an error is counted if it's an internal server error HTTP 5XX


What is SLO?

SLO aka Service-Level Objective is an SLA agreement that defines the expectations and goals that the company should achieve during a defined period of time.

Example:

Imagine a company with a current Uptime-Based SLA is 95% which means they have a tolerated maximum of 1.5days of downtime per month.  (Which is very bad)

We will define our next objectives so the SLA should meet 99%.

For that, we have to take several actions, here are some examples:

  • Review the hardware infrastructure
  • Add preventive monitoring
  • Find the root causes of the downtimes
  • Review the network configurations
  • Review for any single point of failure

Let's Calculate our SLA from Webserver Logs

In this example, we are going to collect Nginx Logs and ship them to Elasticsearch in order to visualize them in Kibana to create an SLA Dashboard

Why vector as logs collector? because it's a lightweight, ultra-fast tool for building observability pipelines, where we will collect, transform, and route the Nginx logs to Elasticsearch.

Step 1: Configure your Nginx to provide more detailed logs
Edit /etc/nginx/nginx.confg in http and block add the following :

log_format apm '"$time_local" client=$remote_addr '
               'method=$request_method request="$request" '
               'request_length=$request_length '
               'status=$status bytes_sent=$bytes_sent '
               'body_bytes_sent=$body_bytes_sent '
               'referer=$http_referer '
               'user_agent="$http_user_agent" '
               'upstream_addr=$upstream_addr '
               'upstream_status=$upstream_status '
               'request_time=$request_time '
               'upstream_response_time=$upstream_response_time '
               'upstream_connect_time=$upstream_connect_time '
               'upstream_header_time=$upstream_header_time';

On your Nginx server definition edit the log configuration as follow:

 
server {
		....
        access_log /var/log/nginx/access.log apm;
        error_log /var/log/nginx/error.log;
		....
}

Step 2: Install Vector to collect, parse and ship your Nginx Logs.

curl --proto '=https' --tlsv1.2 -sSf https://sh.vector.dev | bash

Click for more installation documentation

Using VRL (Vector Remap Langage) to parse the Nginx Logs:

[sources.nginx_source]
type = "file"
ignore_older_secs = 600
include = [ "/var/log/nginx/error.log" ]
read_from = "beginning"
max_line_bytes = 102_400
max_read_bytes = 2_048

[transforms.modify_logs]
type = "remap"
inputs = ["nginx_source"]

#parse each line with VRL regex
source = """
. = parse_regex!(.message, r'^\"(?P<timestamp>.*)\" client=(?P<client>.*) method=(?P<method>.*) request=\"(?P<method_type>.*) (?P<request_path>.*) (?P<http_version>.*)\" request_length=(?P<request_length>.*) status=(?P<status>.*) bytes_sent=(?P<bytes_sent>.*) body_bytes_sent=(?P<body_bytes_sent>.*) referer=(?P<referer>.*) user_agent=\"(?P<user_agent>.*)\" upstream_addr=(?P<upstream_addr>.*) upstream_status=(?P<upstream_status>.*) request_time=(?P<request_time>.*) upstream_response_time=(?P<upstream_response_time>.*) upstream_connect_time=(?P<upstream_connect_time>.*) upstream_header_time=(?P<upstream_header_time>.*)$')

#covnert metrics to proper types
.timestamp = to_timestamp!(.timestamp)
.request_length = to_int!(.request_length)
.status = to_int!(.status)
.bytes_sent = to_int!(.bytes_sent)
.body_bytes_sent = to_int!(.body_bytes_sent)
.upstream_status = to_int!(.upstream_status)
.request_time = to_float!(.request_time)
.upstream_response_time = to_float!(.upstream_response_time)
.upstream_connect_time = to_float!(.upstream_connect_time)
.upstream_header_time = to_float!(.upstream_header_time)
.host = "YOUR_HOSTNAME_HERE"

"""

#for debug mode only - output to console
#[sinks.debug_sink]
#type = "console"
#inputs = ["modify_logs"]
#target = "stdout"
#encoding = "json"

#OUPUT 1 : Elasticsearch
[sinks.send_to_elastic]
type = "elasticsearch"
inputs = [ "modify" ]
endpoint = "https://elasticsearch-endpoint.com"
index = "websitelogs-%F"
mode = "bulk"
auth.user="xxxxxxxxxxxxxxxxxxxxxxx"
auth.password="xxxxxxxxxxxxxxxxxxx"
auth.strategy="basic"

systemctl restart vector.service

Check out the logs of the vector systemd unit :

journalctl -u vector.service

it should look like the following :

For demo purposes, I have deployed an Elasticsearch instance in the elastic cloud

Define your current SLA before defining your SLO


In Kibana, we need to create an Index Pattern to read from Elasticsearch indexes.

Note: The timestamp should be the one from logs, not the Time of Ingest(default one by Elasticsearch).

Our logs are successfully being shipped into Elasticsearch, so the next step is to create a dashboard in Kibana with some graphs in order to calculate our current SLA.

Let's discover the logs

Well, it looks like we got around 8300 for the hit last 15 minutes.

and every hit log is well prepared and looks as follow :

Let's create our first graph, the count of Hits:

Calculate your Aggregate-based

So as we agreed on the formula above, we will consider only 5XX as failed requests, and the rest of the status codes are successful (4XX are considered as client behavior).

so Our SLA Aggregate-based during the last 15mins is 87.04% and during the last 30 days is as follow (98.56%):

This gap of difference between the last 15 mins and the last 30 days leads us to understand that an incident is going on.

Our Dashboard will start to look like this :

Using Metrics instead of Logs

Metrics are so powerful than Logs, you can use them to get real-time dashboards.
In this tutorial, we used Nginx logs and Elasticsearch as a document-store database.
But for better performance and real-time dashboards, I highly recommend using metrics instead of logs.

For that, we can use time-series databases such as InfluxDB or Warp10 to store our metrics and use Grafana as a visualization tool.

On vector to configure the output sink to InfluxDB by adding the following bloc:


#OUPUT 2 : InfluxDB Database
[sinks.influxdb_output]
type = "influxdb_logs"
inputs = [ "modify_logs" ]
bucket = "vector-bucket"
consistency = "any"
database = "xxxxxxxxxxx"
endpoint = "https://your-endpoint.com"
password = "your-password-here"
username = "username"
batch.max_events=1000
batch.timeout_secs=60
namespace = "service"	

then restart your vector service

Conclusion

In this article, we discovered what is SLA and SLO and how SLA Aggregate-based can be calculated from Nginx Log.
I will cover in the next article how to calculate SLA time-based, and how to improve the SLA by finding the root causes.

If you have a problem and no one else can help. Maybe you can hire the Kalvad-Team.