How to handle a massive infrastructure problem
A field-tested 5-step plan for handling a major infrastructure incident: business impact, technical status, inventory, monitoring, and solution.


Tonight is one of these nights. It's 04:30 a.m. and I receive an emergency call (less than 3 hours after going to bed) from this customer which is important to us. They are asking for help, as they have a major issue in their data center on some critical apps, so I decide to go. After putting a pair of jeans and a t-shirt in the dark, as my wife is still sleeping, it's time to hit the road. When I'm driving to the location in my Rolls Royce (I'm an entrepreneur in Dubai, so according to every contact on Linkedin, I have a nice Phantom), I'm starting my mental checklist, which is a process that Pierre and I put in place together in order to deal with this kind of situation. Here comes the 5 steps plan:
- Business situation
- Technical situation
- Inventory
- Monitoring
- Solution

Business situation

Usually, the tech team is under fire, and if you want to understand the impact, you better discuss it with the business team. You will analyze the situation from the business perspective, with the most important question: how much are you losing?
The next question is: how can we make you lose less? Because sometimes, if you lose USD 1m a day, you will be happy to find a temporary solution to only lose USD 200k a day, as it will allow you to limit the damages and give you more time to find the root cause.
Technical situation

Discussing with the tech team is obviously the next step, but compared to some other people, I will do the meeting with the business team present in the room. Why? Because most of the time, they are fighting, not discussing, and nobody has the latest status. You need to explain that they are all on the same boat, and it's a good moment to promote transparency.
The next step is to have a concise description of the issue from a technical perspective associated with a technical schema.
Here comes the ...
Let's be clear, companies with up-to-date documentation are not calling us. Why? Because if you have clear documentation, you usually have full control over your systems, ergo, you don't need us.
The first step is to draft a schema where you think the problem is. In order to respect our customer's privacy, so I will not be able to show you a real schema, but I will provide you a realistic one.
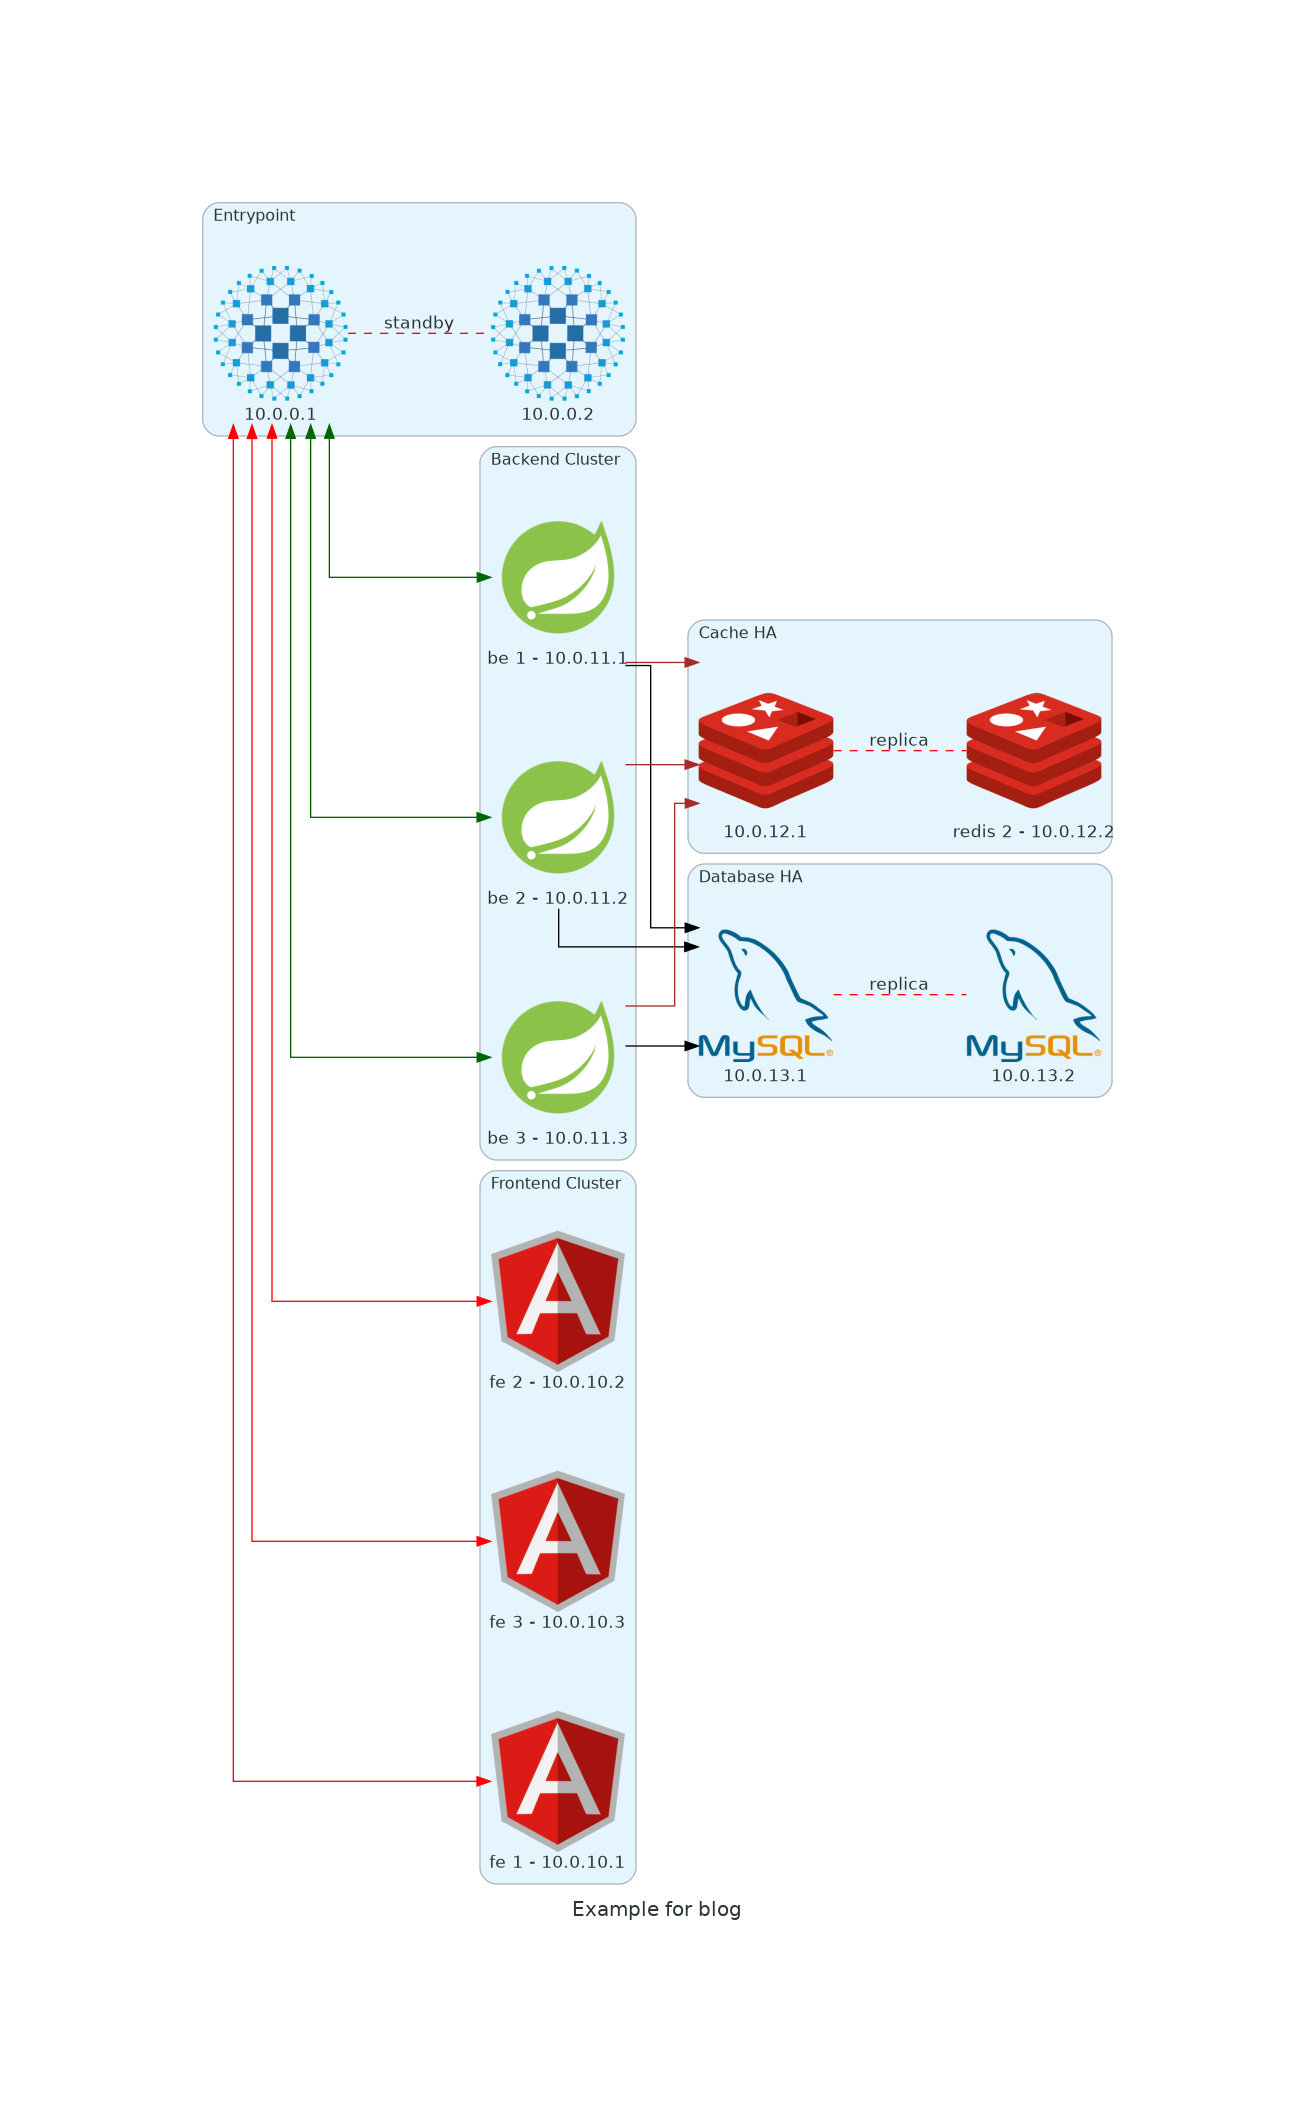
How do I generate this schema? I will use a fabulous technology, named Diagrams from Mingrammer.
It's very easy to set up locally, as it's just one python library
pip install diagramsand then, you have the full power of python to write your schema.
#!/usr/bin/env python3

from diagrams import Cluster, Diagram, Edge
from diagrams.onprem.database import MySQL
from diagrams.onprem.inmemory import Redis
from diagrams.onprem.network import HAProxy
from diagrams.programming.framework import Angular, Spring

with Diagram(name="Example for blog", show=False):
    with Cluster("Entrypoint"):
        ingress = HAProxy("10.0.0.1")
        (
            ingress
            - Edge(label="standby", color="red", style="dashed")
            - HAProxy("10.0.0.2")
        )
    with Cluster("Backend Cluster"):
        backend = [
            Spring("be 1 - 10.0.11.1"),
            Spring("be 2 - 10.0.11.2"),
            Spring("be 3 - 10.0.11.3"),
        ]

    with Cluster("Frontend Cluster"):
        frontend = [
            Angular("fe 1 - 10.0.10.1"),
            Angular("fe 2 - 10.0.10.2"),
            Angular("fe 3 - 10.0.10.3"),
        ]

    with Cluster("Cache HA"):
        main = Redis("10.0.12.1")
        (
            main
            - Edge(label="replica", color="red", style="dashed")
            - Redis("redis 2 - 10.0.12.2")
        )
        backend >> Edge(color="brown") >> main

    with Cluster("Database HA"):
        main = MySQL("10.0.13.1")
        main - Edge(label="replica", color="red", style="dashed") - MySQL("10.0.13.2")
        backend >> Edge(color="black") >> main

    ingress >> Edge(color="darkgreen") << backend
    ingress >> Edge(color="red") << frontend
Now that you know the infrastructure, it's time to transcribe it into an inventory.
Inventory is boring but necessary
Why do we need an inventory after all? Do we already have the necessary data?
Wrong, you are missing a big part of it, for example, is that a VM or a bare metal server? And you would like to populate your infrastructure with more information like what is the OS running on this server.
And even if right now we have only 12 servers, you don't want to do this manually. That's how we introduce our favorite tool: Ansible.
Ansible is an open-source software provisioning, configuration management, and application-deployment tool enabling infrastructure as code. It runs on many Unix-like systems, and can configure both Unix-like systems as well as Microsoft Windows. It includes its own declarative language to describe system configuration. Ansible was written by Michael DeHaan and acquired by Red Hat in 2015. Ansible is agentless, temporarily connecting remotely via SSH or Windows Remote Management (allowing remote PowerShell execution) to do its tasks.
Ansible will allow us not only to execute tasks but also to populate data inside the inventory system.
Here come Netbox
Most people don't know Netbox, but it's IMHO the best software for inventory (with its fork, Nautobot).
I always have Netbox installed on my laptop, which means that even if the company cannot provide any new servers, I can start to populate my inventory.
But why a web inventory where you can just write a YAML file compatible with Ansible?
Because you want everybody to participate and review: don't forget it's now 05:30 a.m., they have been working most probably all night, and you want to have all hands on deck to avoid more errors.
Once the inventory is populated with minimal information, you launch Ansible to fill it even more.
Peekaboo?

Then comes the interrogation part: what did people were hiding from us?
Usually, we have some very disturbing discoveries, I'm going to share our worst discoveries of this year so far:
- Red Hat 4 in production (yes, in 2021).
- HAProxy vulnerable to Heartbleed (yes, still in 2021).
- Debian 6 in production (on the same infrastructure as the Red Hat 4, and even better, inside the same cluster!).
That's really a bad moment to pass, because:
- At Kalvad, we follow a full transparency policy, so we are not going to lie to cover anyone.
- if the systems are old and outdated, we are going to say it.
- the business team (mostly the C-level people) is going to be very angry at the tech team.
But let's be clear: without this investigation, you cannot move forward. You need all facts to have a clear vision!
And here comes the final complicated part: you need to calm down the C-level/business team, as the priority is to find a solution, not to behead people.

But at least, now we have a full inventory system, we can transform the Netbox's data into ssh configuration and we can start working for real.
One more bad question, promise!?!
And that's the most painful question for the tech team: do you have a monitoring system in place? and if yes, is that implemented on this platform?
Unfortunately, most tech teams are going to not give you a clear answer about this, so you need to roast them a little with a simpler question:
Do you have monitoring working on this platform, yes or no?
Over almost 5 years, the answer has always been no. Some of them bought some monitoring system, but it was never properly set up.
So in order to anticipate this situation, we have developed a small set of tools, based on an incredible tool: Monit.

Monit is the most efficient monitoring that I know so far, it can monitor:
- files
- disks
- process
- full system metrics
- remote systems
Furthermore, it's written in C, so it's super light!
Unfortunately, some parts of this code are really bad, so we are going to make it nicer by probably using Dhall (a new article coming about Dhall soon).
But let me just show you some basic bash scripts that we use for disks, for example:
# DISK Monitoring
rm -f $APP_HOME/monit-$MONIT_VERSION/conf/monit.d/disk.conf
MOUNT_POINTS=$(df -h | grep -v tmpfs | grep '%' | cut -d '%' -f 2 | awk '{ print $1}' | grep -v Mounted)
for MOUNT_POINT in $MOUNT_POINTS
do
  MOUNT_POINT_NAME=$(echo $MOUNT_POINT | sed 's/\//_slash_/g')
  echo $MOUNT_POINT_NAME
  cat <<EOF >> $APP_HOME/monit-$MONIT_VERSION/conf/monit.d/disk.conf
check filesystem $MOUNT_POINT_NAME with path $MOUNT_POINT
      if space usage > 95% then exec "$APP_HOME/monit-$MONIT_VERSION/scripts/slack.sh"
      if service time > 300 milliseconds for 5 cycles then exec "$APP_HOME/monit-$MONIT_VERSION/scripts/slack.sh"
EOF
done
As you can see, we are listing all disks, and are raising alerts if:
- the disks are filled more than 95%
- the time to execute the request is more than 300ms
Another example is how we get the os version:
#Get os
rm -f $APP_HOME/monit-$MONIT_VERSION/conf/monit.d/release.conf
rm -f $APP_HOME/monit-$MONIT_VERSION/scripts/release.sh
mkdir -p $APP_HOME/monit-$MONIT_VERSION/scripts
if [ -f "/etc/os-release" ]; then
    cat <<EOF >> $APP_HOME/monit-$MONIT_VERSION/scripts/release.sh
#!/bin/bash
cat /etc/os-release | grep PRETTY_NAME | cut -d '"' -f 2
EOF
else
    if [ -f "/etc/redhat-release" ]; then
        cat <<EOF >> $APP_HOME/monit-$MONIT_VERSION/scripts/release.sh
#!/bin/bash
cat /etc/redhat-release
EOF
    fi
fi

chmod +x $APP_HOME/monit-$MONIT_VERSION/scripts/release.sh
cat <<EOF >> $APP_HOME/monit-$MONIT_VERSION/conf/monit.d/release.conf
check program os_release with path $APP_HOME/monit-$MONIT_VERSION/scripts/release.sh with timeout 10 seconds
      if status != 0 then alert
EOF
We can then display the version of the system directly inside the monit interface.

We are also going to provide remote access to monit, in order to connect to it directly through the web interface.
I will not go further on the configuration of monit, as it should be a whole article by itself.
Important metrics

By experience, we are going to concentrate on the following metrics:
- Disk usage
- CPU usage
- RAM usage
- Network usage
We are going to trigger alerts if one of these metrics is abnormal, and send it to a central system (by slack, by opening tickets, by sending emails, etc...)
it is going to help us diagnose the issue.
Unfortunately, sometimes it's not enough, so you need to have a bigger picture, like monitoring the connection from the backend server to MySQL, and guess what, Monit can do this also!!!
check host {{ monit_mysql_target.host }} with address {{ monit_mysql_target.address }}
      if failed
      	 port {{ monit_mysql_target.port }} protocol mysql username {{ monit_mysql_target.username}} password "{{ monit_mysql_target.password }}"
      then exec "/usr/local/bin/alert.sh"
      else if succeeded then exec "/usr/local/bin/alert.sh"
So now, from the backend server, we can monitor the connection to the database.
Then you can add Redis, and more if needed.
Solution
Now you have a good base of work, and you can investigate properly and find a solution.
I'm going the share with you the top 3 issues that we found this year:
- Storage of pictures inside the database (MySQL), on an outdated version, creating replication issue and a 2TB cluster with 0 Bytes available on the physical servers. We were able to fix this by moving all pictures to a fresh Minio cluster, which reduced drastically the size of the database to 25GB.
- Upgrade of firewall by the network team without telling anyone, and they accidentally cut the connection between 1 out of 3 backend servers to the main database (and the load balancer didn't have any health check). We planned a session with the network team in order to explain how to automate their devices and not face this kind of issue anymore. We also help the sysadmin team and the dev team to have some "health" endpoint and configure HAProxy to check it before sending traffic
- Jenkins open to the internet, without a password, script kiddies had fun with it. The solution was simple: we removed the server from the network, racked a new one, and set up the full Jenkins configuration back.
To conclude this article, I would like to send a message to all people out there: IT is at the core of all your systems nowadays, so don't neglect it and hire good people! It's never too late to fix a situation.
If you have a problem and no one else can help. Maybe you can hire the Kalvad-Team.
Data Center on Fire at 4 a.m.?
We help teams stabilize broken infrastructure under pressure. We work the business impact first, map the real topology, then cut the bleeding before chasing root cause. If your tech team is firefighting and your docs do not match reality, we have done this in fintech, government, and PCI-DSS environments and we can do it for yours. Call us before the next outage.