What do monitoring metrics tell us?

Monitoring is a wide topic that provides the real-time status of the health of targeted applications, services, infrastructure ..etc.
Real-time streaming of these metrics and visualizing them into graphs are the most crucial parts of the monitoring service.
Introduction
In this article, we will cover what metrics can tell us about what's happening inside our production environment. We will assume that we have the following stack installed across all of our infra :

Telegraf: Used to collect metrics and push them to an output(influxDB), Get Telegraf Now
InfluxDB: Time-Serie Database optimized to store metrics in time , Get InfluxDB Now
Grafana: Used to visualize data from different sources, and create amazing real-time charts (Influxdbin our case), Get Grafana Now
What Metrics Should I collect?
All metrics matters for investigations, analysis, troubleshooting, preventive monitoring, but here are a list of the must-collected metrics:
Server Resources: RAM, CPU, Load, AVG Load, Disk, Disk IO, Temperature
For that we should configure our telegraf as follow :
# Read metrics about cpu usage
[[inputs.cpu]]
## Whether to report per-cpu stats or not
percpu = true
## Whether to report total system cpu stats or not
totalcpu = true
## If true, collect raw CPU time metrics.
collect_cpu_time = true
## If true, compute and report the sum of all non-idle CPU states.
report_active = true


# Read metrics about disk usage by mount point
[[inputs.disk]]
## By default stats will be gathered for all mount points.
## Set mount_points will restrict the stats to only the specified mount points.
# mount_points = ["/"]

## Ignore mount points by filesystem type.
ignore_fs = ["tmpfs", "devtmpfs", "devfs", "overlay", "aufs", "squashfs"]


# Read metrics about disk IO by device
[[inputs.diskio]]


# Get kernel statistics from /proc/stat
[[inputs.kernel]]
# no configuration

# Read metrics about memory usage
[[inputs.mem]]
# no configuration

# Get the number of processes and group them by status
[[inputs.processes]]
# no configuration

# Read metrics about system load & uptime
[[inputs.system]]
# no configuration

# # Get kernel statistics from /proc/vmstat
[[inputs.kernel_vmstat]]
#   # no configuration

# # Provides Linux sysctl fs metrics
[[inputs.linux_sysctl_fs]]
#   # no configuration
These metrics can be nicely represented as follows :


Network: Cards, uplinks
For that we should configure our telegraf as follow :
# # Read metrics about network interface usage
[[inputs.net]]
#   ## By default, telegraf gathers stats from any up interface (excluding loopback)
#   ## Setting interfaces will tell it to gather these explicit interfaces,
#   ## regardless of status.
#   ##
#   # interfaces = ["eth0"]
#   ##

# Read TCP metrics such as established, time wait and sockets counts.
[[inputs.netstat]]
# no configuration
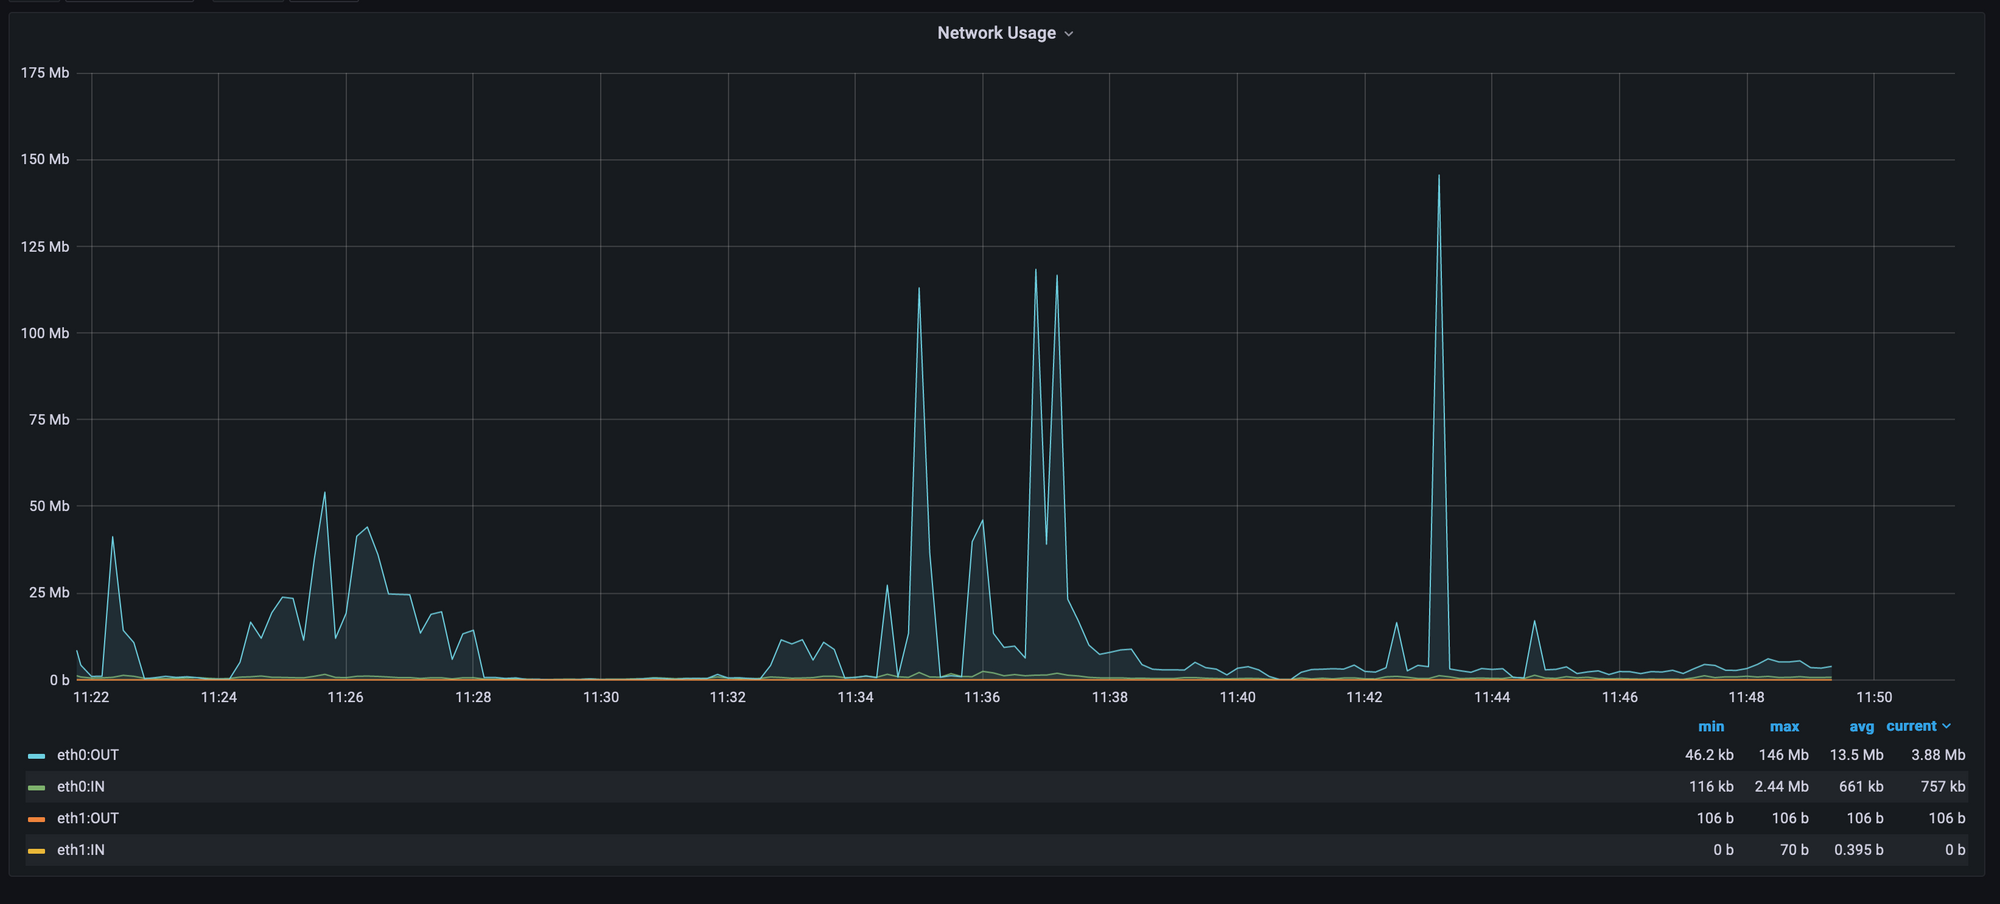
These metrics can be represented as follow :

From the screenshot, we will easily understand that users are using this server to download file because we have some spikes on the eth:OUT graph.
Applications: Systemd units, Files, or directories:
[[inputs.systemd_units]]
## Set timeout for systemctl execution
timeout = "25s"
The procstat plugin can be used to monitor the system resource usage of one or more processes. The procstat_lookup metric displays the query information, specifically the number of PIDs returned on a search.
In the following example, we will collect metrics for Systemd Units and
# Monitor process cpu and memory usage for
[[inputs.procstat]]
  ## PID file to monitor process Nginx
  pid_file = "/var/run/nginx.pid"

[[inputs.procstat]]
  ## Unit Name to monitor process SSHD
   systemd_unit = "sshd.service"

[[inputs.procstat]]
  ## Unit Name to monitor process IPFS
   systemd_unit = "ipfs.service"
In Grafana we can see the data as Follow :

This will give us a very detailed window to understand what is causing a shortage of resources, and how our software is behaving (for example we can detect a memory leak and understand where it comes from). For more documentation of procstate plugin.
Database metrics are also important, let's take Postgres for example
[[inputs.postgresql]]
  ## specify address via a url matching:
  address = "host=localhost user=postgres sslmode=disable"

  # databases = ["app_production", "testing"]

  ## with pool_mode set to transaction.
  prepared_statements = true
The metrics can be fetched on Grafana as follows:

We can see the Queries Per Second, And Postgres Rows by Operations(Fetched, Returned, Inserted, Updated, Deleted).
So this will help us understand what's really going on backstage, allowing us to act quickly in order to save the health of the server and promote our business benefit.
More documentation for postgresql here,
Uses Cases
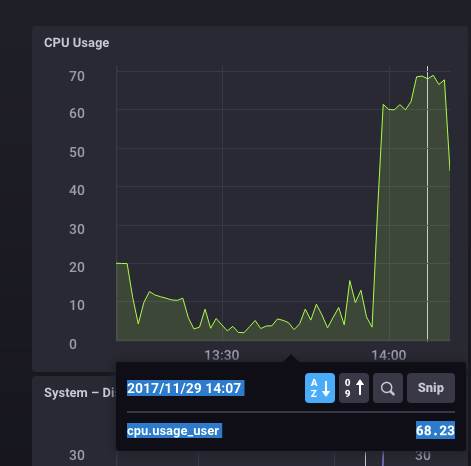
CPU spike:
A CPU spike is a sudden increase in processor utilization, which can cause temporary or permanent damage to the CPU and motherboard. Spikes can be caused by the simultaneous running of applications that use a large number of resources and RAM.

Disk IO Spike :
Disk I/O spikes are extreme changes in disk demands that can cause huge impacts on the server.
Disk I/O Spike can be due to Sudden high usage of Databases Read or Right Which can be related to an intended cause(promotion for example) or to an unintended cause(Attack Attempt or Scrape )
Memory leaks:
A memory leak occurs when the software or the app create a memory in the heap and does not free it during the time, the cumulation of the reserved RAM increases, the following screenshot shows a real memory leak:

The consequence of memory leak is that it brings down the performance of the server by shrinking down the available memory which can cause an Out-Of-Memory and lead the server to be unreachable in a few minutes or even seconds.
Conclusion
In this article, we discovered what's the most used stack to collect metrics from servers, and what are the main metrics that we should collect in order to observe, monitor, and prevent our server from any future problems.
The next part of this article will cover more uses cases and explain them in-depth.
If you have a problem and no one else can help. Maybe you can hire the Kalvad-Team.
