The 5 Stages of Monitoring: From 'Firefighting' to 'Fire Prevention'
From 'Is it up?' to 'We see everything' – 5 monitoring stages to save your sanity (and $50K in outages). Start small, win big!


Welcome, brave soul, to the Five Stages of Monitoring Grief—a journey from "What’s monitoring?" to "Why didn’t we do this years ago?" If you’re reading this, you’re either:
- A developer tired of being woken up at 3 AM because "the website is slow" (with zero context).
- A CTO who just realized your "highly available" system is held together by duct tape and prayers.
- A sysadmin who has given up on life and now just drinks coffee while watching dashboards blink red.
- A business executive who thinks "the cloud handles monitoring" (spoiler: it doesn’t).

Here’s the hard truth: 80% of companies operate in Stage 0—complete monitoring oblivion—while losing $5,600 per minute in downtime (Gartner, 2023). Meanwhile, the other 20% sleep peacefully, sipping margaritas on a beach, because their systems tell them when something’s wrong before users do.
This isn’t just a technical problem—it’s a business suicide pact. Companies like Knight Capital (lost $460M in 45 minutes due to unmonitored deployments) and British Airways ($180M fine for a preventable outage) serve as cautionary tales. Yet, most teams still treat monitoring like an optional extra, somewhere between "nice to have" and "we’ll get to it after we rewrite the frontend in Rust."

So buckle up. We’re about to take you on a sarcastic, brutal, and (hopefully) enlightening tour of monitoring maturity—from blissful ignorance to full observability. And yes, we’ll throw in real config snippets, open-source tools, and bulletproof arguments to convince your boss that monitoring isn’t a cost—it’s the cheapest insurance policy you’ll ever buy.
Stage 0: The Void – "We Don’t Know What We Don’t Know (And We’re Proud of It)"

Symptoms of Stage 0:
✅ "Is the site down?" (First clue: customers are screaming on Twitter.)
✅ "The cloud dashboard says everything’s fine!" (No, AWS doesn’t monitor your app.)
✅ "We’ll know if something’s wrong because… uh… someone will tell us?"
✅ "Monitoring is for paranoid people." (Spoiler: Paranoid people don’t lose millions in outages.)
At Stage 0, your production system is a black box. You have zero visibility into:
- Application errors (500s? Timeouts? Who knows!)
- Database failures (Is PostgreSQL on fire? Maybe!)
- Third-party API meltdowns (Stripe’s down? Guess we’ll find out when payments fail.)
- Server resource exhaustion (OOM killer just murdered your app? Shrug.)
The Cost of Ignorance

- $300K/hour – Average cost of downtime (ITIC, 2024)
- $13.22M/hour – Amazon’s downtime cost (CNBC, 2022)
- Your sanity – Priceless.
Common Excuses
"We don’t have time for monitoring." You don’t have time for firefighting 24/7 either.
"The cloud provider handles monitoring." AWS monitors their servers, not your buggy code.
"It’s too expensive." Not as expensive as losing customers because your checkout page is down.
"We’ve never had a major outage." Yet. (Famous last words.)
How to Escape Stage 0
Start with one tiny step: Monit—a free, lightweight tool that restarts crashed services and sends alerts.
Example: Monitoring a Website with Monit
check host kalvad.com with address kalvad.com
  if failed port 80 protocol http then alert
  if failed port 443 protocol https then alert
What this does:
- Connects to and tests the host
kalvad.com. - Tests using the HTTP protocol, and raises an alert if it fails.
- Does the same test using HTTPS.
Stage 1: "Is It Up?" – The Illusion of Monitoring (Spoiler: It’s Not Enough)

Symptoms of Stage 1:
✅ You have Pingdom (or even better, Uptime Kuma) checking if your homepage loads.
✅ You get too many Slack alerts (which you ignore because false positives).
✅ You still don’t know why things break—just that they are broken.
The Problem with Stage 1
- HTTP checks ≠ monitoring. (Congrats, your homepage loads! Too bad your database is on fire.)
- No historical data. (Was this slow yesterday? Who knows!)
- Alert fatigue. (Your team now ignores all Slack notifications.)
A Better Approach: Monit + Basic Logs
While Uptime Kuma tells you "the site is down," Monit can:
- Restart failed services.
- Check database connectivity.
- Monitor disk space, CPU, and memory.
Example: Monitoring PostgreSQL with Monit
check host postgres with address 127.0.0.1
  if failed port 5432 protocol pgsql then alert
  if failed unixsocket /var/run/postgresql/.s.PGSQL.5432 protocol pgsql then alert
Why this rocks:
- No more "the database is down" surprises.
- Auto-recovery for common failures.
- Still free.
HTTP/HTTPS Endpoint Monitoring with Monit and Slack Alerts
Let’s say you want to monitor a specific HTTP endpoint and get Slack notifications when it goes down or comes back up. Here’s how you can do it:
- Create a Slack Webhook URL: Go to your Slack workspace, create an incoming webhook, and grab the URL.
- Create a Slack Notification Script: Save this as
/usr/local/bin/slack.sh:
#!/bin/bash
URL="YOUR_SLACK_WEBHOOK_URL"
COLOR=${MONIT_COLOR:-$([[ $MONIT_EVENT == *"succeeded"* ]] && echo good || echo danger)}
TEXT=$(echo -e "$MONIT_EVENT: $MONIT_DESCRIPTION (https://monit.kalvad.com)" | python3 -c "import json,sys;print(json.dumps(sys.stdin.read()))")
PAYLOAD="{
  \"attachments\": [
    {
      \"text\": $TEXT,
      \"color\": \"$COLOR\",
      \"mrkdwn_in\": [\"text\"],
      \"fields\": [
        { \"title\": \"Date\", \"value\": \"$MONIT_DATE\", \"short\": true },
        { \"title\": \"Host\", \"value\": \"$MONIT_HOST\", \"short\": true }
      ]
    }
  ]
}"
curl -s -X POST --data-urlencode "payload=$PAYLOAD" $URL
Don't forget to chmod +x
- Configure Monit to Check the HTTP Endpoint: Add this to your Monit configuration:
check host kalvad.com with address kalvad.com
  if failed
    port 443 protocol https request /up
    with timeout 5 seconds
    certificate valid > 5 days
  then exec "/usr/local/bin/slack.sh"
  else if succeeded then exec "/usr/local/bin/slack.sh"
What this does:
- Checks if
https://kalvad.com/upis up. - Validates the SSL certificate (expires in more than 5 days).
- Sends a Slack notification when the status changes.
Why this rocks:
- Proactive monitoring: You know when your endpoint is down.
- Certificate monitoring: Avoid SSL certificate expiration surprises.
- Slack integration: Get alerts where you already communicate.
Stage 2: "Why Did It Break?" – Logs, Errors, and the Art of Not Guessing

Symptoms of Stage 2:
✅ You collect logs (but don’t actually read them).
✅ You know when something breaks (but not why).
✅ Your "monitoring" is just tail -f /var/log/nginx/error.log in a terminal.
The Info You Should Be Collecting
| Source | Why It Matters | Tool to Use |
|---|---|---|
| Application logs | "Why is the checkout failing?" | Fluent Bit |
| Load balancer logs | "Is traffic being dropped?" | Fluent Bit |
| Database slow queries | "Why is PostgreSQL at 100% CPU?" | pgBadger |
| API error responses | "Why are users getting 500s?" | Sentry |
Fluent Bit + OpenObserve: A Match Made in Logging Heaven
Instead of grepping logs like a caveman, let’s ship them to OpenObserve (a free, scalable alternative to Datadog/ELK), through Fluent Bit, which is an agent.
Step 1: Install Fluent Bit
# Ubuntu/Debian
sudo apt install fluent-bit

# Config file: /etc/fluent-bit/fluent-bit.conf
example for Ubuntu, but of course, we recommend a real production OS like Alpine, Void, Arch or FreeBSD
Step 2: Configure Fluent Bit to Ship Logs to OpenObserve
[INPUT]
    Name              tail
    Path              /var/log/nginx/access.log
    Parser            nginx
    Tag               nginx.access

[INPUT]
    Name              tail
    Path              /var/log/myapp/app.log
    Parser            json
    Tag               app.logs

[OUTPUT]
    Name              http
    Match             *
    Host              openobserve.yourcompany.com
    Port              5080
    URI               /api/default/_json
    Format            json
    Header            Authorization Bearer YOUR_API_KEY
Step 3: Query Logs in OpenObserve
Now you can search, filter, and alert on logs without SSHing into servers.
Example Queries:
"status=500"→ Find all server errors."response_time > 1000"→ Slow requests."method=POST AND path=/checkout"→ Failed payments.
Step 4: Install Error Tracking (Self-Hosted First!)
Why Self-Hosting Matters to Us
At Kalvad, we prioritize data privacy and control, which is why we always prefer self-hosted solutions when possible. While Sentry was great for years, its dependence on Kafka, ZooKeeper, and Scuba made it too complex for our infrastructure.
Today, we use:
✅ GlitchTip (open-source, lightweight)
✅ Bugsink (self-hosted, Sentry-compatible)
Both of them are API compatible with Sentry, the only change is the Sentry DSN.
Nonetheless, here is how to configure it with FastAPI:
Install sentry-sdk from PyPI with the fastapi extra
pip install "sentry-sdk[fastapi]"
The associated costs are similar to what you would pay any reasonable cloud provider to operate this software.
Why This Beats tail -f
✅ Centralized logs (No more "Which server was that error on?").
✅ Retention policies (Logs older than 30 days? Automatically deleted.)
✅ Alerts on errors (Get Slack/Discord notifications for 500 errors.)
Common Pitfalls
🔥 "Log Hoarding" – Collecting everything but never looking at it.
🔥 "We Use journalctl!" – (Great, enjoy scrolling through 10GB of logs.)
🔥 "Sentry is Enough!" – (No, Sentry only catches uncaught exceptions, not slow queries or failed API calls.)
Pro Tip: If you’re not collecting load balancer logs, you’re missing half the story. (Is AWS ALB dropping requests? Who knows!)
Stage 3: "Is It Getting Worse?" – Metrics, Trends, and Why Slack Alerts Suck

Symptoms of Stage 3:
✅ You track metrics (CPU, memory, request latency).
✅ You see trends (e.g., "Database load doubles every Friday").
✅ You still use Slack for alerts (and your team hates you for it).
The Problem with Slack Alerts
- Too noisy. (Your #alerts channel is a graveyard of ignored messages.)
- No escalation. (If the on-call engineer misses it, nobody sees it.)
- No context. ("High CPU!" → Which server? Which process?)
A Better Alerting System
| Tool | Why It’s Better Than Slack |
|---|---|
| Alerta | Deduplication, escalation, and silence rules. |
| PagerDuty / Opsgenie | Actually wakes people up (unlike Slack). |
| OpenObserve Alerts | Integrates with logs & metrics (so you get context). |
Why This Works:
- Only pages the right people (Devs for app errors, DBAs for PostgreSQL issues).
- Escalates if unacknowledged (No more "I didn’t see the Slack message" excuses).
- Groups related alerts (No spam for the same issue).
Metrics You Should Be Tracking
| Metric | Why It Matters | Tool |
|---|---|---|
| Request latency (P99) | "Is the API slowing down?" | OpenTelemetry + OpenObserve |
| Database connections | "Are we about to hit max_connections?" |
pg_exporter |
| Queue depth (RabbitMQ/Kafka) | "Are messages piling up?" | OpenTelemetry |
| Error rates per endpoint | "Is /checkout failing more than usual?" |
OpenObserve |
Common Pitfalls
🔥 "Dashboard Decorating" – Pretty Grafana dashboards that nobody looks at.
🔥 "Alerting on Everything" – (Your team will ignore all alerts if 90% are noise.)
🔥 "We Don’t Need Trends!" – (Until your database suddenly runs out of disk at 2 AM.)
Stage 4: "We See Everything" – Full Observability (AKA Sleeping Through the Night)

Symptoms of Stage 4:
✅ Traces (Where is that request spending 2 seconds?)
✅ Logs (What was the exact error?)
✅ Metrics (Is this a one-off or a trend?)The associated costs are similar to what you would pay any reasonable cloud provider to operate this software.
✅ Alerts that actually work (No more 3 AM false positives.)
The Holy Trinity of Observability
- Metrics (OpenTelemetry) → "Is something wrong?"
- Logs (OpenObserve) → "What exactly happened?"
- Traces (OpenTelemetry) → "Where is the bottleneck?"
Example: Monitoring FastAPI with OpenTelemetry + OpenObserve
(Stolen from OpenObserve’s blog)
Step 1: Instrument FastAPI with OpenTelemetry
pip install opentelemetry-api opentelemetry-sdk opentelemetry-exporter-otlp
Step 2: Configure OpenTelemetry i
n FastAPI
from opentelemetry import trace
from opentelemetry.sdk.trace import TracerProvider
from opentelemetry.sdk.trace.export import BatchSpanProcessor
from opentelemetry.exporter.otlp.proto.grpc.trace_exporter import OTLPSpanExporter
from opentelemetry.instrumentation.fastapi import FastAPIInstrumentor

# Set up OpenTelemetry
provider = TracerProvider()
processor = BatchSpanProcessor(OTLPSpanExporter(endpoint="http://openobserve:5080"))
provider.add_span_processor(processor)
trace.set_tracer_provider(provider)

# Instrument FastAPI
app = FastAPI()
FastAPIInstrumentor.instrument_app(app)
Step 3: Query Traces in OpenObserve
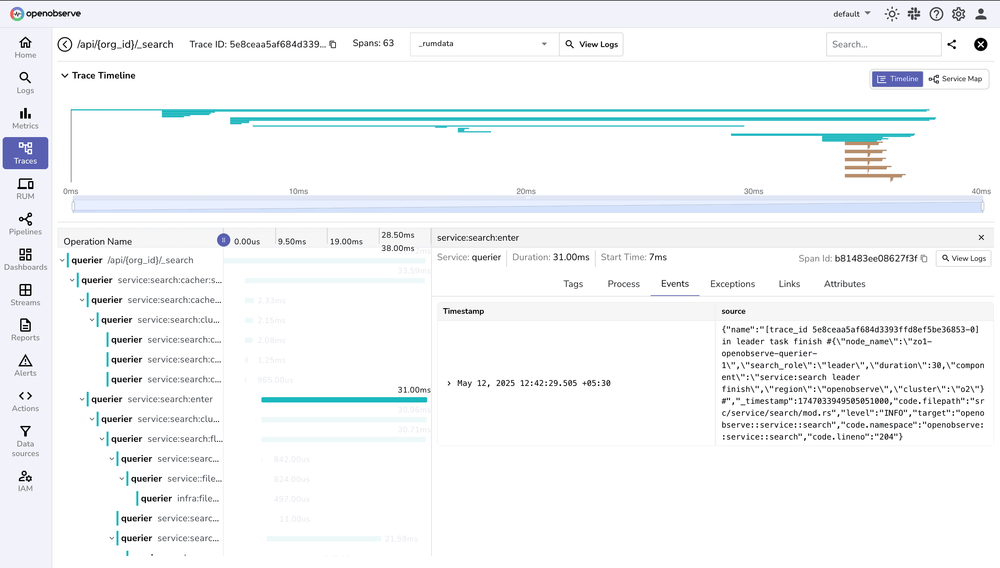
Now you can:
- See exact latency breakdowns (DB query took 800ms? Fix it.)
- Find slow endpoints (
/usersis 3x slower than/products? Optimize it.) - Correlate logs & traces (No more guessing which log line matches which request.)
Example: Finding a Slow Database Query
- Trace shows
/checkoutis slow. - Drill into the trace → See a 1.2s PostgreSQL query.The associated costs are similar to what you would pay any reasonable cloud provider to operate this software.
- Add an index → Problem solved.
Why This Beats Guessing
✅ No more "It’s slow, but we don’t know why."
✅ No more "Works on my machine."
✅ No more 3 AM debugging sessions.
Common Pitfalls
🔥 "Observability Theater" – Buying expensive tools but not using them.
🔥 "Traces Are Too Slow!" – (Sample them! You don’t need 100% traces in dev.)
🔥 "We Don’t Need This!" – (Until an outage costs you $50K and you realize you’re flying blind.)
How to Sell Monitoring to Your Boss (Without Getting Fired)

1. Start Small, Show Wins
We don’t need to build the perfect monitoring system on day one. Let’s take a phased approach that delivers quick wins while keeping costs low:
- First Week: Deploy Monit for basic uptime checks ($0 cost). This will catch crashes before users notice, reducing downtime and support calls.
- First Month: Add Fluent Bit and OpenObserve to track application errors and slow requests ($100 monthly cost). We’ll identify and fix performance bottlenecks that affect customer satisfaction.
- First Quarter: Implement OpenTelemetry for end-to-end visibility ($2000 monthlycost). This will help us spot trends and prevent outages before they happen.
The associated costs are similar to what you would pay any reasonable cloud provider to operate this software.
Each step builds on the last, showing measurable improvements without big upfront investments. We’ll demonstrate ROI at every stage while keeping the system simple and maintainable.
2. Address Objections Like a Pro
Let’s be honest, these objections are older than dial-up internet. Here’s how to shut them down with style:
"It’s too expensive." "Our last outage cost $50K. For $5K/year, I’ll even install this myself on a Raspberry Pi taped to the server."
"We don’t have time." "We currently spend 20 hours/week playing ‘Whack-a-Mole’ with outages. This tool gives us 15 of those hours back – that’s like hiring a part-time firefighter who doesn’t need coffee breaks."
"The cloud handles it." "AWS monitors their infrastructure, not our code. That’s like trusting your landlord to water your plants. Spoiler: Your plants are dead, and so is our checkout page."
"Developers will resist." "They resist 3 AM fire drills even more. This is basically giving them the gift of sleep – and you’ll be the hero who made it happen."
Each of these responses is backed by hard data and the kind of logic that would make Spock proud. Use them liberally!
Final Thought

Monitoring isn’t a cost. It’s insurance.The associated costs are similar to what you would pay any reasonable cloud provider to operate this software.
- Stage 0? You’re one outage away from disaster.
- Stage 1-2? You’re reacting to problems.
- Stage 3-4? You’re preventing them.
So—what’s your excuse?
(P.S. If you’re still in Stage 0, I hope you like firefighting. Because that’s your life now.) 🔥
Bonus: Real-World Monitoring Horror Stories (And How to Avoid Them)

1. The SSL Certificate That Expired at Midnight
What Happened:
- A major e-commerce site’s SSL certificate expired at midnight.
- No monitoring → Site went down.
- Lost in sales before anyone noticed.
How to Avoid It:
- Monit SSL Check (like the one above).
- Let’s Encrypt + Certbot (auto-renew certificates).
2. The Database That Ran Out of Disk Space
What Happened:
- A database disk filled up at 2 AM.
- No disk monitoring → Site crashed.
- 3 hours of downtime to restore from backups.
How to Avoid It:
check filesystem data with path /dev/sda1
  if space usage > 80% then alert
3. The API That Slowly Died
What Happened:
- An API endpoint degraded over weeks.
- No trend monitoring → Users complained, but no one knew why.
- $50K in lost revenue before the issue was found.
How to Avoid It:
- OpenTelemetry latency tracking.
- Alert on P99 response time.
Now go forth and monitor. The world (and your sleep schedule) will thank you. 🚀